Introduction
HRRN stands for Highest Response Ratio Next. It is a non-preemptive CPU scheduling algorithm where the ready process with the highest response ratio gets the CPU next.
HRRN improves on SJF by giving waiting time a direct role. Short jobs still get preference, but a longer process can also be selected if it has waited long enough.
Core Idea of HRRN Scheduling
HRRN balances two factors: burst time and waiting time. A process with a small burst time gets a naturally higher chance, but the response ratio also increases as the process waits.
The formula is:
Response Ratio = (Waiting Time + Burst Time) / Burst Time
It can also be written as:
Response Ratio = 1 + (Waiting Time / Burst Time)
As waiting time increases, the response ratio increases. This creates an aging effect, where long-waiting processes gradually become more likely to run.
Whenever the CPU becomes free, HRRN checks all processes in the ready queue and calculates their response ratios. The process with the highest response ratio is selected. Once selected, the process runs until it finishes or blocks. HRRN is non-preemptive, so a newly arrived process cannot interrupt the currently running process.
HRRN Scheduling Example
Consider five processes with arrival time and burst time:
Process | Arrival Time | Burst Time |
|---|---|---|
P1 | 0 | 8 |
P2 | 1 | 4 |
P3 | 2 | 9 |
P4 | 3 | 5 |
P5 | 7 | 2 |
At time 0, only P1 has arrived, so P1 runs from 0 to 8. At time 8, the available processes are P2, P3, P4, and P5.
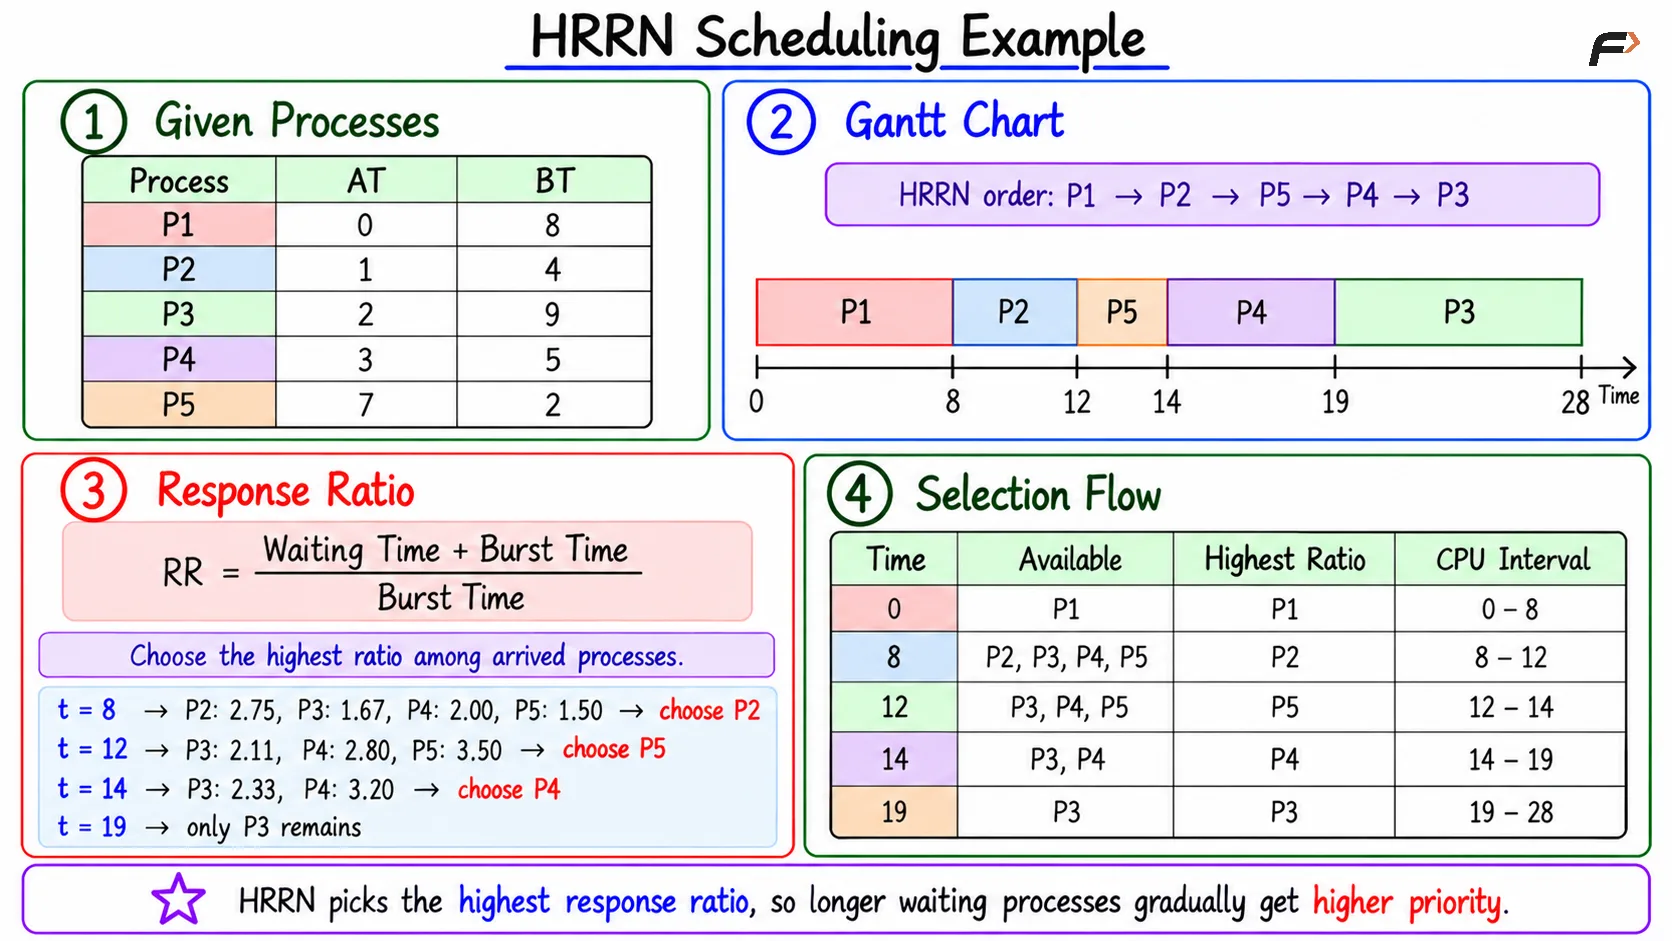
HRRN Scheduling Example
Time | Available Choice | Highest Ratio Process | CPU Interval |
|---|---|---|---|
0 | P1 | P1 | 0 to 8 |
8 | P2, P3, P4, P5 | P2 | 8 to 12 |
12 | P3, P4, P5 | P5 | 12 to 14 |
14 | P3, P4 | P4 | 14 to 19 |
19 | P3 | P3 | 19 to 28 |
So, the final execution order is P1, P2, P5, P4, P3.
Metric Calculation
The main formulas are:
CT: finish time of the process
TAT:
CT - ATWT:
TAT - BTRT:
first start time - AT
Process | CT | TAT | WT | RT |
|---|---|---|---|---|
P1 | 8 | 8 | 0 | 0 |
P2 | 12 | 11 | 7 | 7 |
P3 | 28 | 26 | 17 | 17 |
P4 | 19 | 16 | 11 | 11 |
P5 | 14 | 7 | 5 | 5 |
Average TAT = 13.6, average WT = 8.0, and average RT = 8.0.
Strengths and Weaknesses of HRRN
Strengths | Weaknesses |
|---|---|
Balances waiting time and burst time | Requires burst-time estimation |
Reduces starvation compared to SJF | Non-preemptive, so running jobs are not interrupted |
Gives aging effect through waiting time | Response ratios must be recalculated |
Summary
HRRN scheduling selects the ready process with the highest response ratio. The response ratio uses both waiting time and burst time, so the scheduler considers short-job preference as well as how long a process has waited.
It reduces starvation compared to SJF because waiting processes gain priority over time. Its main limitations are burst-time prediction, non-preemptive behavior, and the need to recompute response ratios at each scheduling decision.
Be the first to add a comment.