Introduction
A database needs more than stored records to work well. It also needs information about its structure, estimates that help plan queries, regular upkeep, and evidence about what happens while queries run.
Metadata, statistics, maintenance, and observability support these needs. Understanding their different roles helps explain why a query becomes slow, what should be checked, and which action might help.
Four Concepts, Four Different Jobs
Concept | Main question | Examples |
|---|---|---|
Metadata | What is defined in the database? | Tables, columns, data types, constraints, and indexes |
Optimizer statistics | What does the stored data look like? | Estimated row counts and value distribution |
Maintenance | What needs upkeep? | Refreshing statistics and reclaiming reusable space |
Observability | What is happening inside the database? | Running queries, errors, lock waits, and resource use |
These concepts work together. For example, metadata describes an index, statistics help decide whether to use it, and runtime evidence shows whether the chosen plan performs well.
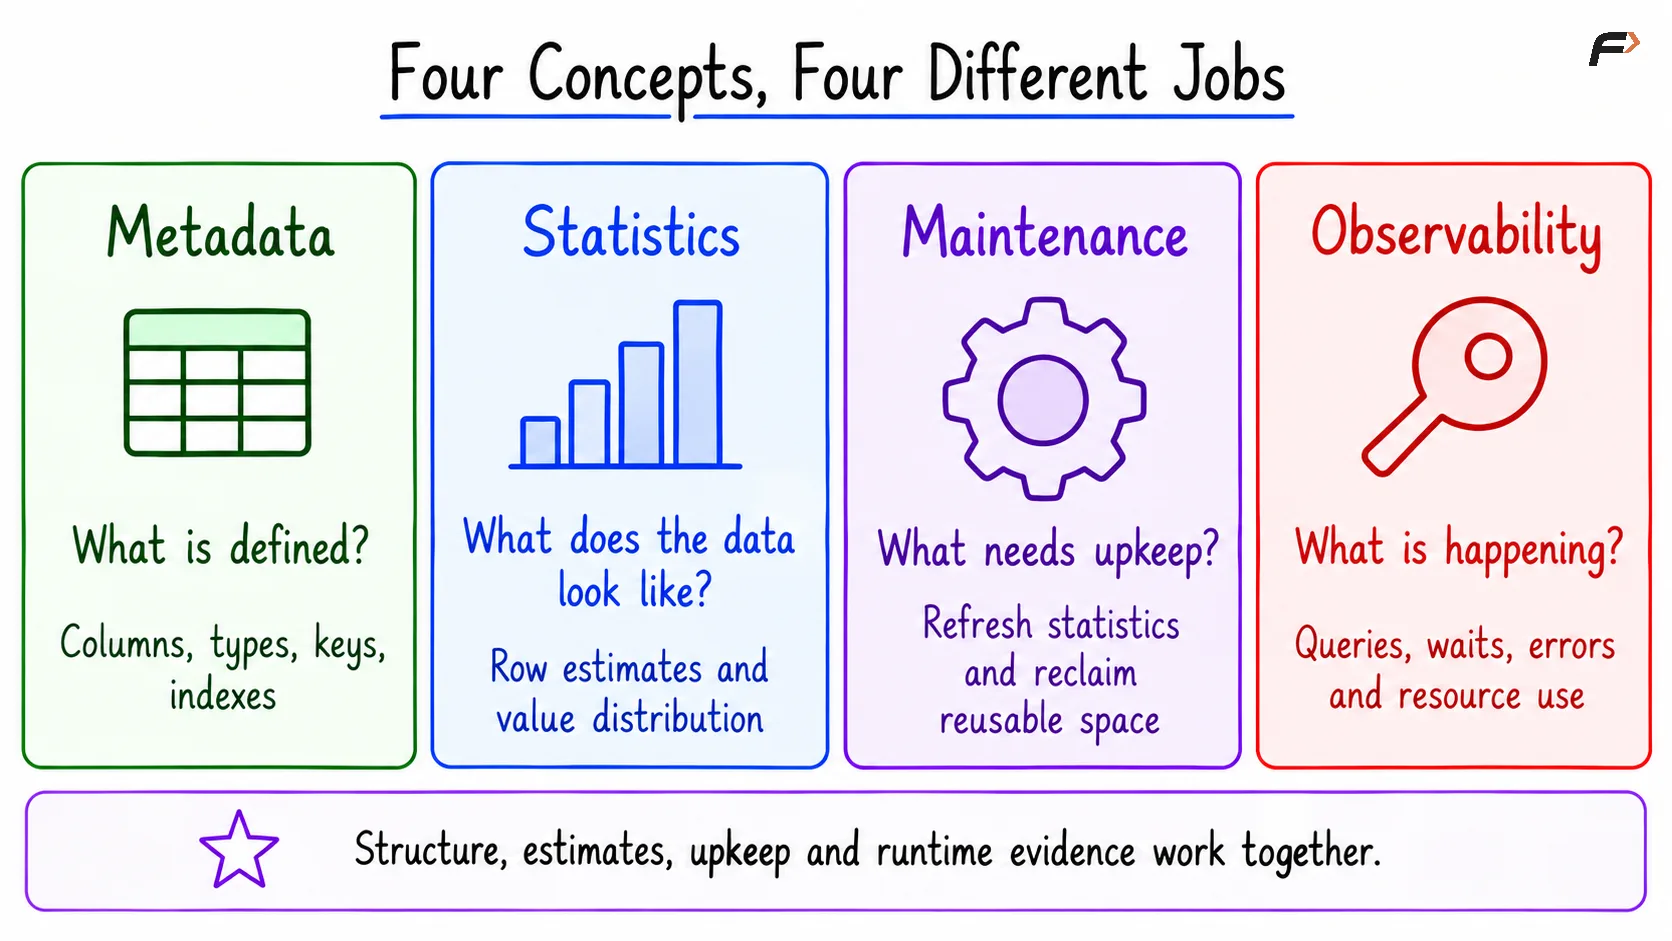
Four concepts , Four Different Jobs
Example Table
Consider an employee table that stores each employee’s identifier, name, and department.
employee_id | employee_name | department |
|---|---|---|
101 | Asha | Support |
102 | Ravi | Finance |
103 | Meera | Support |
104 | Kabir | Support |
employee_id is the primary key. All three columns require a value.
There are four employees: three in Support and one in Finance. The examples below use this table.
What Is Database Metadata?
Metadata is information that describes database objects.
For the employee table, metadata includes:
The table name and column names.
Each column’s data type.
Whether a column allows
NULL.The primary key and other constraints.
Any indexes defined on the table.
The value Asha is stored data. The fact that employee_name is a required character column is metadata.
Databases maintain this information in system catalogs, also commonly described as a data dictionary. Applications and administrators can inspect supported catalog views rather than changing internal catalog tables directly.
Both MySQL and PostgreSQL provide information_schema views for inspecting common metadata. Database-specific catalogs expose additional details. The information visible to an account can depend on its permissions.
Optimizer Statistics Are Estimates
The query optimizer chooses a plan for executing a query. A plan describes operations such as scanning a table, using an index, or joining tables.
Optimizer statistics help estimate how much work different plans might require. Depending on the database, these statistics can describe:
The approximate number of rows.
The number of distinct values in a column.
Common values and how frequently they occur.
The proportion of
NULLvalues.How values are distributed across ranges.
For example, most employees in the sample table belong to Support. A query requesting Support employees returns a large share of this small table. Reading the table directly may therefore be reasonable, even if an index exists.
Statistics can become stale, meaning they no longer describe the current data well. A large import or deletion can change the table while its stored estimates still reflect an earlier state.
Statistics may also be based on samples. Therefore, an estimated row count is not a substitute for an exact COUNT(*) query over the rows visible to that query.
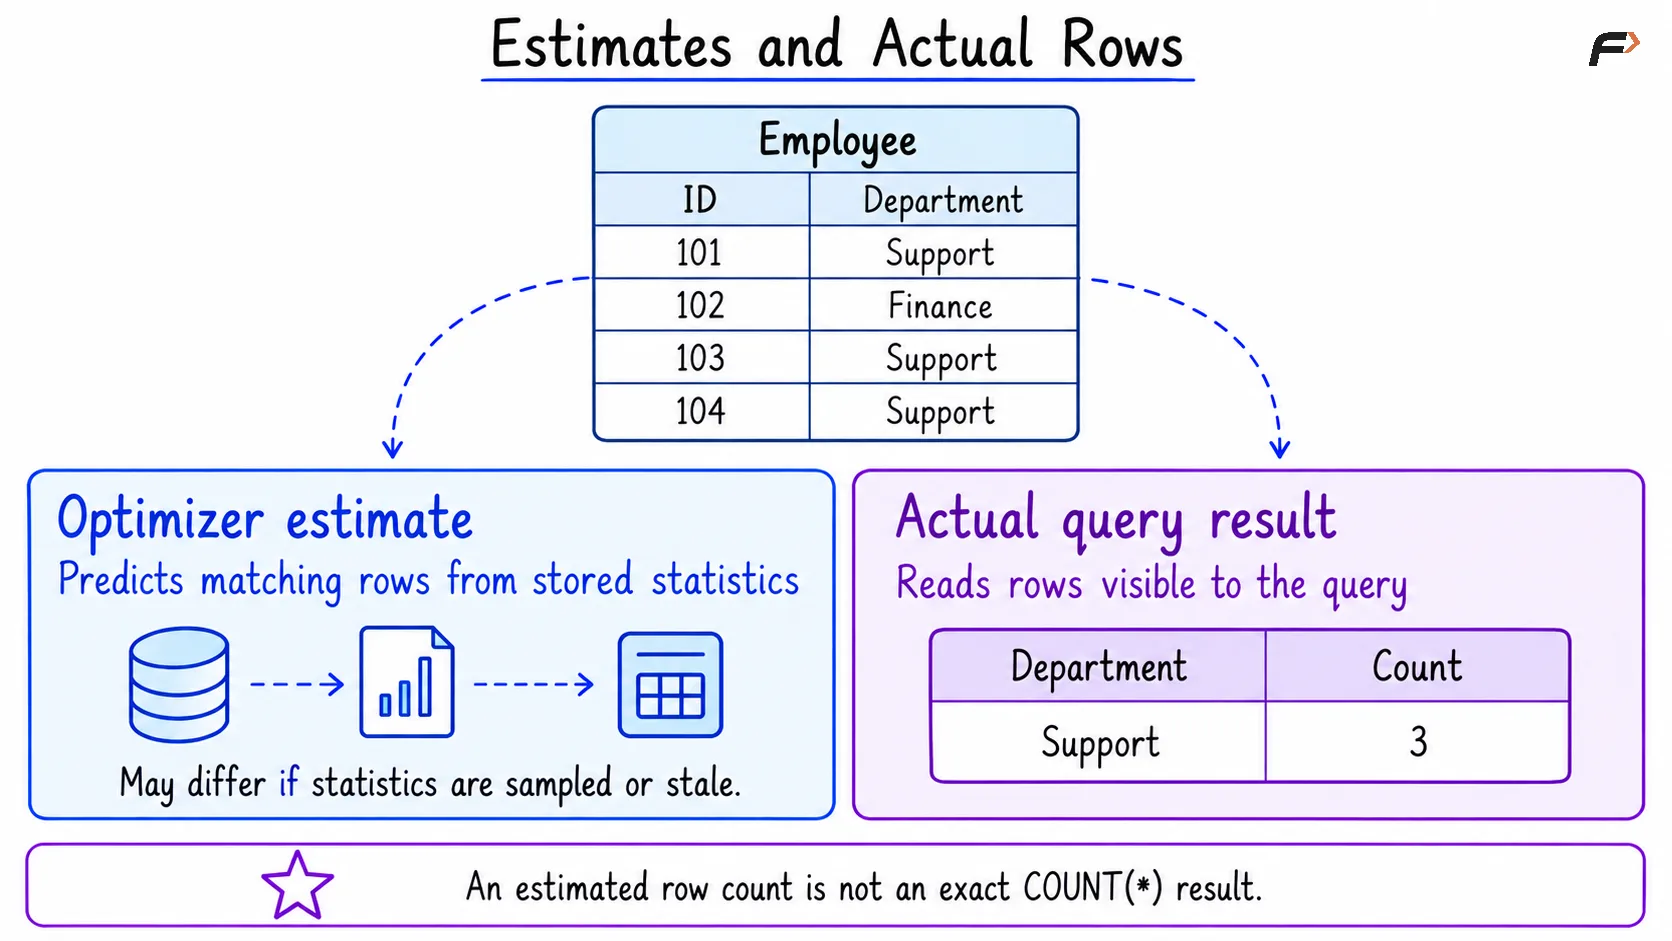
Estimates and actual rows
Refreshing Statistics
MySQL uses ANALYZE TABLE to refresh relevant table statistics. PostgreSQL uses ANALYZE.
These commands update information used for planning. They do not change employee values, and they do not guarantee that a particular index or plan will be selected.
Automatic statistics collection also exists. Manual refreshes are useful when evidence suggests that the current estimates are unsuitable, such as after a major data change.
What Does Database Maintenance Include?
Database maintenance keeps database storage and supporting information in a useful condition.
Maintenance task | Purpose |
|---|---|
Refresh statistics | Help the optimizer work with current estimates |
Clean up obsolete row versions | Make eligible space available for reuse |
Review table and index growth | Identify unnecessary storage growth |
Check backup and restore readiness | Confirm that recovery remains possible |
Review maintenance activity | Detect delayed or unsuccessful upkeep |
Maintenance commands differ between database systems.
MySQL: Background Maintenance
MySQL performs background work, including purge, which removes old row-version information when it is no longer required.
MySQL does not use PostgreSQL’s VACUUM command. Statistics can be refreshed with ANALYZE TABLE.
Operations such as MySQL OPTIMIZE TABLE or PostgreSQL VACUUM FULL can involve significant work and locking. They should address an identified need rather than be treated as an automatic fix for every slow query.
PostgreSQL: VACUUM and ANALYZE
PostgreSQL can retain older row versions after updates and deletions because other transactions may still need them.
VACUUM removes obsolete row versions when they are no longer needed and makes their space available for reuse. It also performs other upkeep, including work that helps prevent transaction ID wraparound.
Ordinary VACUUM usually makes space reusable inside the table rather than shrinking the file substantially on disk.
ANALYZE has a separate purpose: collecting optimizer statistics. PostgreSQL’s autovacuum system normally schedules both vacuuming and analysis when needed.
What Is Database Observability?
Database observability means using available evidence to understand how a database is behaving and why.
For example, a slow query might be:
Reading many rows.
Waiting for another transaction’s lock.
Competing for CPU or disk access.
Using a plan based on poor estimates.
The symptom is the same, but the causes and solutions differ.
Useful Evidence
Evidence | What it helps explain |
|---|---|
Query duration | How long requests take |
Query throughput | How many requests finish over a period |
Active connections and queries | What is currently running |
Lock waits | Whether transactions are blocking one another |
CPU, memory, and disk activity | Whether resources are under pressure |
Error and slow-query logs | Which operations fail or take unusually long |
Execution plans | How the database intends to obtain the result |
Metrics provide measurements over time. Logs record events. Application traces can connect a database query to the wider request that triggered it.
MySQL provides runtime information through facilities such as Performance Schema, the sys schema, and configured logs. PostgreSQL provides views such as pg_stat_activity for session activity and pg_stat_user_tables for table activity.
Availability and detail depend on configuration and permissions. Monitoring data can also contain sensitive query text, so access and retention should be controlled.
Optimizer Statistics vs. Runtime Statistics
These two uses of “statistics” should not be confused:
Optimizer statistics help predict the cost of a query.
Runtime statistics report activity, such as scans, updates, or time spent executing statements.
Runtime counters may accumulate over time or reset. They do not automatically represent the current number of rows in a table.
A Compact Example
Objective: Create the sample table, inspect its metadata, refresh optimizer statistics, and compare a query plan with an actual result.
The MySQL example assumes a database has already been selected. The PostgreSQL example creates the table in the public schema.
1. Create the Sample Table
Consider the following queries to create and populate employee.
CREATE TABLE employee ( employee_id INT PRIMARY KEY, employee_name VARCHAR(50) NOT NULL, department VARCHAR(30) NOT NULL);INSERT INTO employee (employee_id, employee_name, department)VALUES (101, 'Asha', 'Support'), (102, 'Ravi', 'Finance'), (103, 'Meera', 'Support'), (104, 'Kabir', 'Support');Expected result: The table contains the four rows shown in the example table.
2. Inspect Column Metadata
Consider the following queries to list the columns and check whether they allow NULL.
SELECT COLUMN_NAME AS column_name, IS_NULLABLE AS is_nullableFROM information_schema.columnsWHERE TABLE_SCHEMA = DATABASE() AND TABLE_NAME = 'employee'ORDER BY ORDINAL_POSITION;In MySQL query ,DATABASE() identifies the currently selected database. AS gives the output columns the displayed names.
ordinal_position or ORDINAL_POSITION gives each column’s position in the table definition.
Expected result for both:
column_name | is_nullable |
|---|---|
employee_id | NO |
employee_name | NO |
department | NO |
The primary key makes employee_id non-nullable. The other two columns explicitly use NOT NULL.
This result describes the table structure. It does not return employee records.
3. Refresh Optimizer Statistics
Consider the following commands to refresh statistics for employee.
ANALYZE TABLE employee;Expected outcome: Statistics are refreshed successfully, and employee data remains unchanged.
MySQL normally returns a status report. PostgreSQL normally returns an ANALYZE completion tag. These commands do not produce an employee result table, and the collected estimates can vary.
4. Inspect a Query Plan
Consider the following queries to inspect the plan for finding Support employees.
EXPLAINSELECT employee_id, employee_nameFROM employeeWHERE department = 'Support';Expected outcome: Each database returns a plan describing how it expects to read and filter the table.
The output format and estimates differ between MySQL and PostgreSQL. A table scan is reasonable for this tiny table, which has no index on department.
Plain EXPLAIN shows the plan without returning the matching employee rows. EXPLAIN ANALYZE executes the statement and adds measured execution information. It is different from the statistics-refresh command ANALYZE.
5. Check the Actual Matching Rows
Consider the following queries to retrieve the Support employees.
SELECT employee_id, employee_nameFROM employeeWHERE department = 'Support'ORDER BY employee_id;Expected result for both:
employee_id | employee_name |
|---|---|
101 | Asha |
103 | Meera |
104 | Kabir |
The query returns three matching rows. This actual result is separate from the optimizer’s estimate of how many rows will match.
A Simple Troubleshooting Workflow
When a query becomes slow, use a short, evidence-based process:
Observe: Identify the affected query and compare its duration with normal behavior.
Diagnose: Inspect its plan, estimated versus actual rows when available, lock waits, and resource use.
Act: Address the identified cause. For example, refresh stale statistics, shorten a blocking transaction, or improve the query.
Verify: Compare the same workload again and check whether the change helped.
A slow query does not automatically mean that an index must be added or rebuilt. Likewise, refreshing statistics cannot resolve every lock wait or resource shortage.
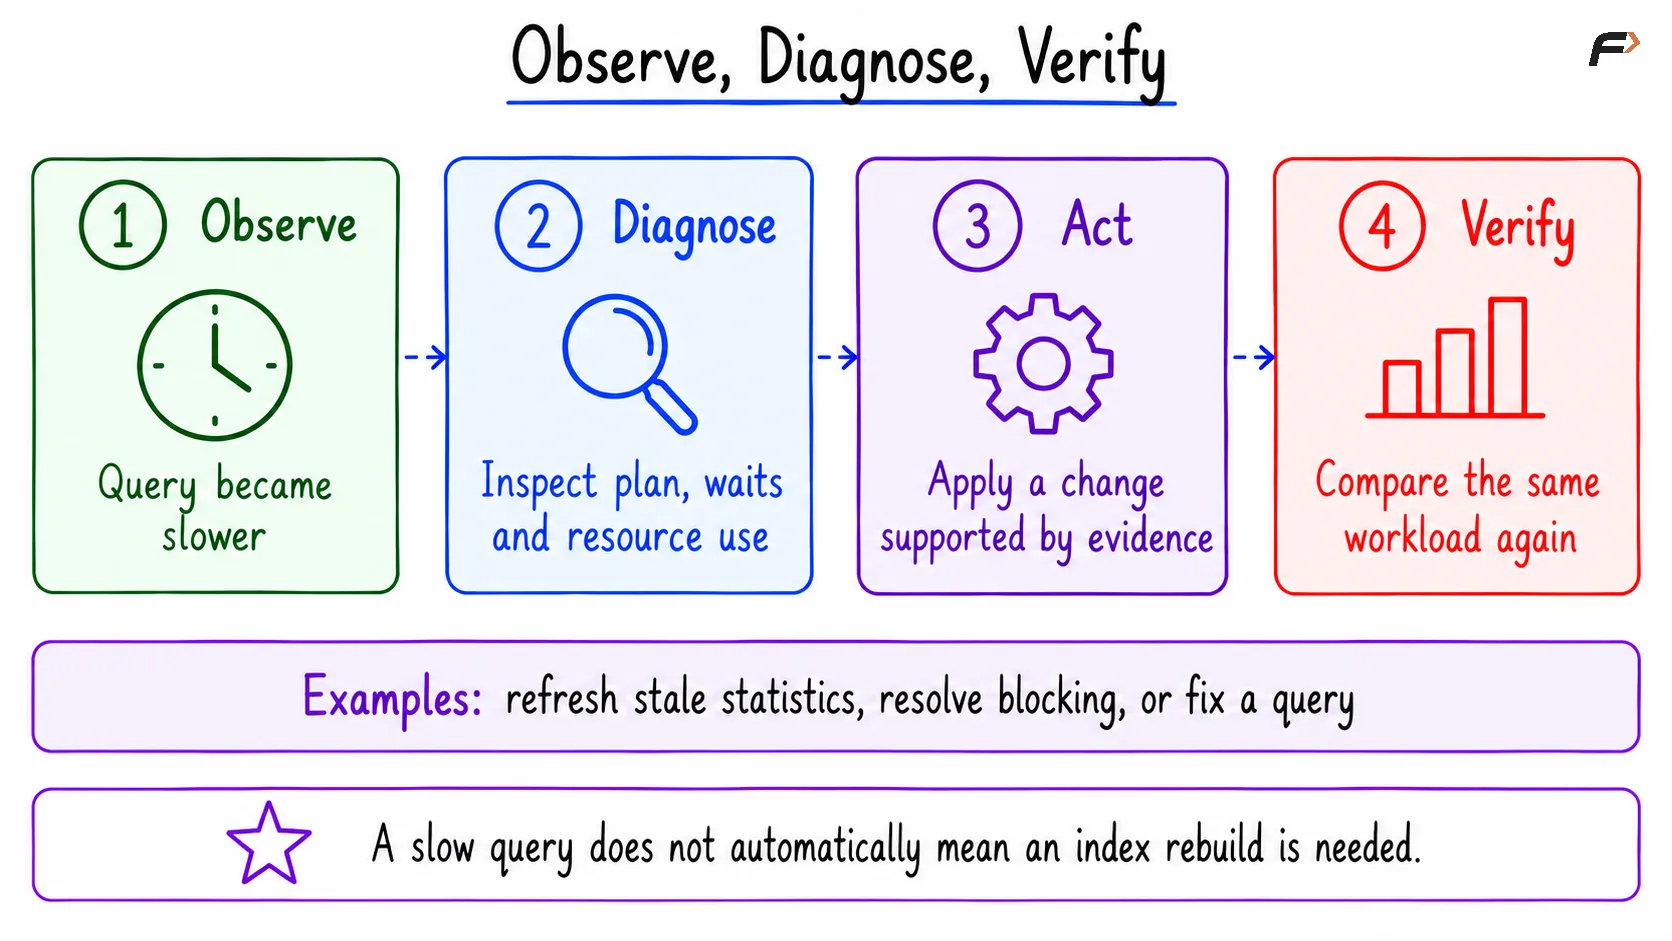
Observe , Diagnose , Verify
Summary
Metadata describes database objects, while optimizer statistics help predict the work required by queries. Maintenance keeps statistics and storage in good condition, and observability provides evidence about activity, delays, errors, and resource use.
These concepts are most useful together. Inspect the structure, check the estimates and runtime behavior, choose maintenance based on the cause, and verify the result instead of applying the same fix to every problem.
Be the first to add a comment.