Introduction
Database tables store individual records, but reports often require counts, totals, averages, and comparisons. For example, an academic report might need the number of students in each department or the average marks of students meeting a particular condition.
Data summarization in DBMS converts detailed records into meaningful summaries. SQL provides clauses for choosing data, filtering records, forming groups, calculating summaries, and arranging the results.
An Example Table
The examples use a table named StudentResult. Each row represents one student’s result in a common assessment.
StudentResult : initial data
StudentID | Name | Department | Marks |
|---|---|---|---|
101 | Asha | Computer Science | 80.00 |
102 | Ravi | Electronics | 60.00 |
103 | Meera | Computer Science | 90.00 |
104 | Arjun | Electronics | 70.00 |
105 | Neha | Computer Science | NULL |
StudentID uniquely identifies a student. Marks stores decimal values out of 100.
Neha’s NULL means that her marks have not been recorded. It does not mean that she scored zero.
1. SELECT: Choose the Output Columns
SELECT specifies which columns or calculated values appear in the result.
Objective: Display only student identifiers and names.
The source table contains four columns:
StudentID | Name | Department | Marks |
|---|---|---|---|
101 | Asha | Computer Science | 80.00 |
102 | Ravi | Electronics | 60.00 |
103 | Meera | Computer Science | 90.00 |
104 | Arjun | Electronics | 70.00 |
105 | Neha | Computer Science | NULL |
Consider the following queries to display the identifier and name of each student.
SELECT StudentID, NameFROM StudentResult;Expected result
StudentID | Name |
|---|---|
101 | Asha |
102 | Ravi |
103 | Meera |
104 | Arjun |
105 | Neha |
SELECT StudentID, Name chooses the two output columns. FROM StudentResult identifies the table containing them.
All five students appear, but the department and marks columns are omitted. Choosing output columns is called projection.
2. FROM: Identify the Source Table
FROM identifies the table supplying the records.
Objective: Retrieve the complete student result records, including all four columns.
Consider the following queries to display every column from StudentResult.
SELECT *FROM StudentResult;Expected result
StudentID | Name | Department | Marks |
|---|---|---|---|
101 | Asha | Computer Science | 80.00 |
102 | Ravi | Electronics | 60.00 |
103 | Meera | Computer Science | 90.00 |
104 | Arjun | Electronics | 70.00 |
105 | Neha | Computer Science | NULL |
In SELECT *, the * means “include all columns.” The FROM clause identifies where those columns and records come from.
All five rows appear because the query has no filtering condition.
3. WHERE: Filter Individual Rows
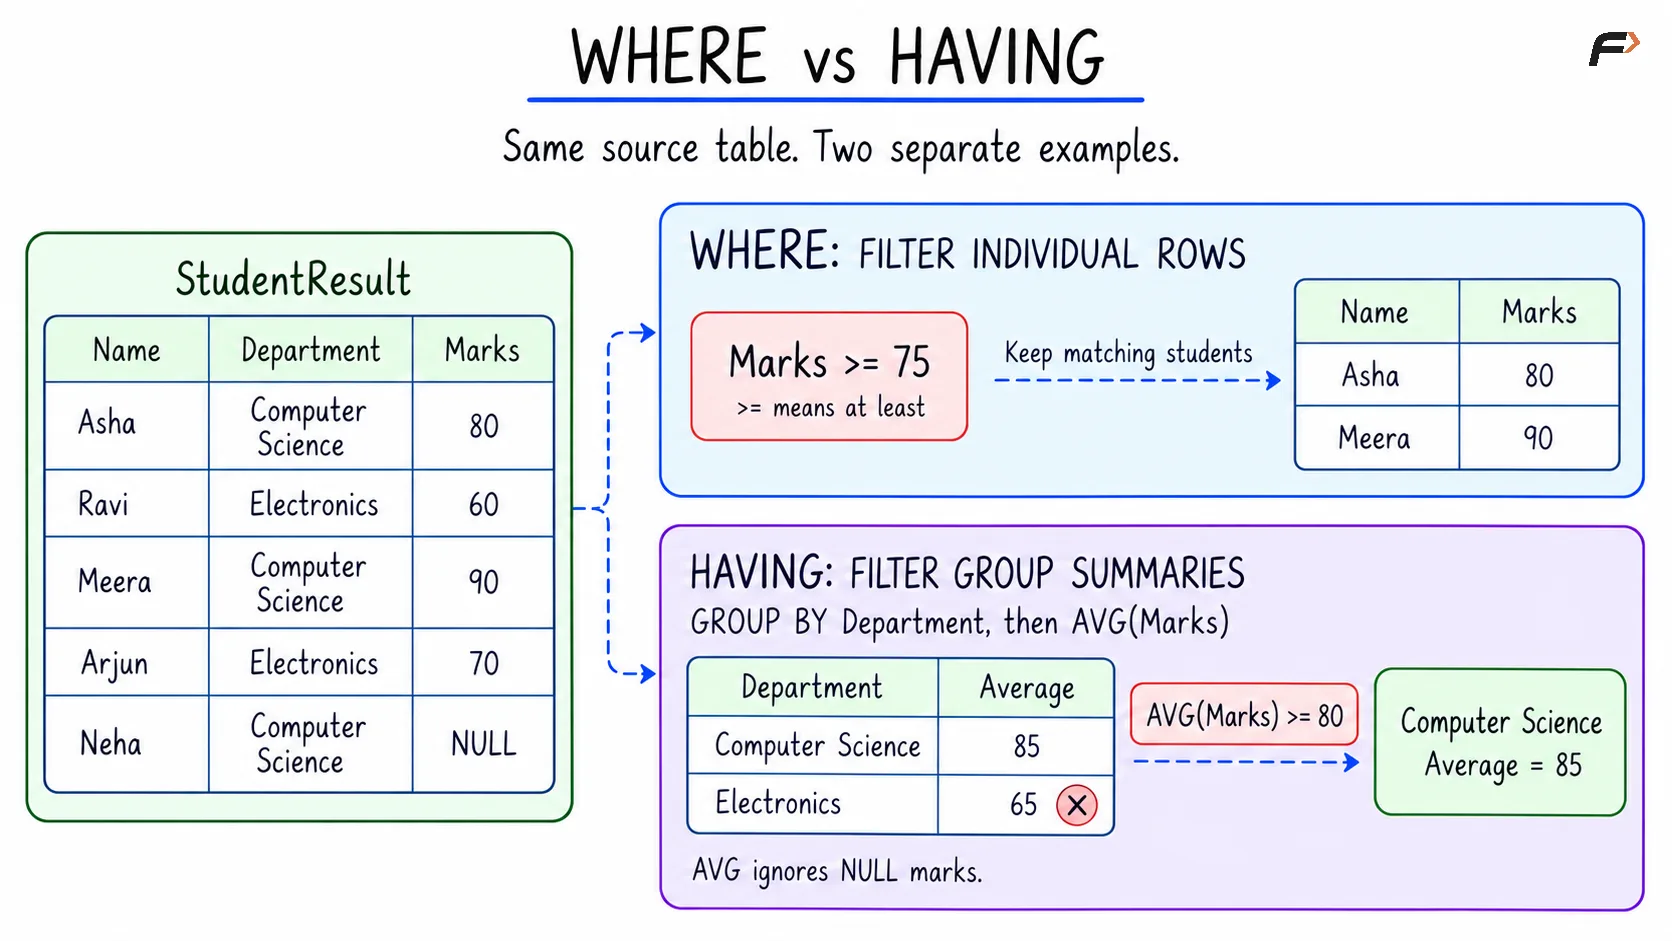
WHERE keeps individual rows that satisfy a condition. It determines which records are available for any grouping or aggregate calculations in the query.
Objective: Find students who scored at least 75.
The relevant source values are:
StudentID | Name | Marks |
|---|---|---|
101 | Asha | 80.00 |
102 | Ravi | 60.00 |
103 | Meera | 90.00 |
104 | Arjun | 70.00 |
105 | Neha | NULL |
Consider the following queries to display students whose marks are at least 75.
SELECT StudentID, Name, MarksFROM StudentResultWHERE Marks >= 75;Expected result
StudentID | Name | Marks |
|---|---|---|
101 | Asha | 80.00 |
103 | Meera | 90.00 |
The operator >= means “greater than or equal to.”
Asha and Meera satisfy the condition. Ravi and Arjun score below 75. Neha’s unknown marks do not satisfy the comparison, so her row is also excluded.
Filtering changes the query result; it does not delete records from the table.
4. GROUP BY: Form Groups
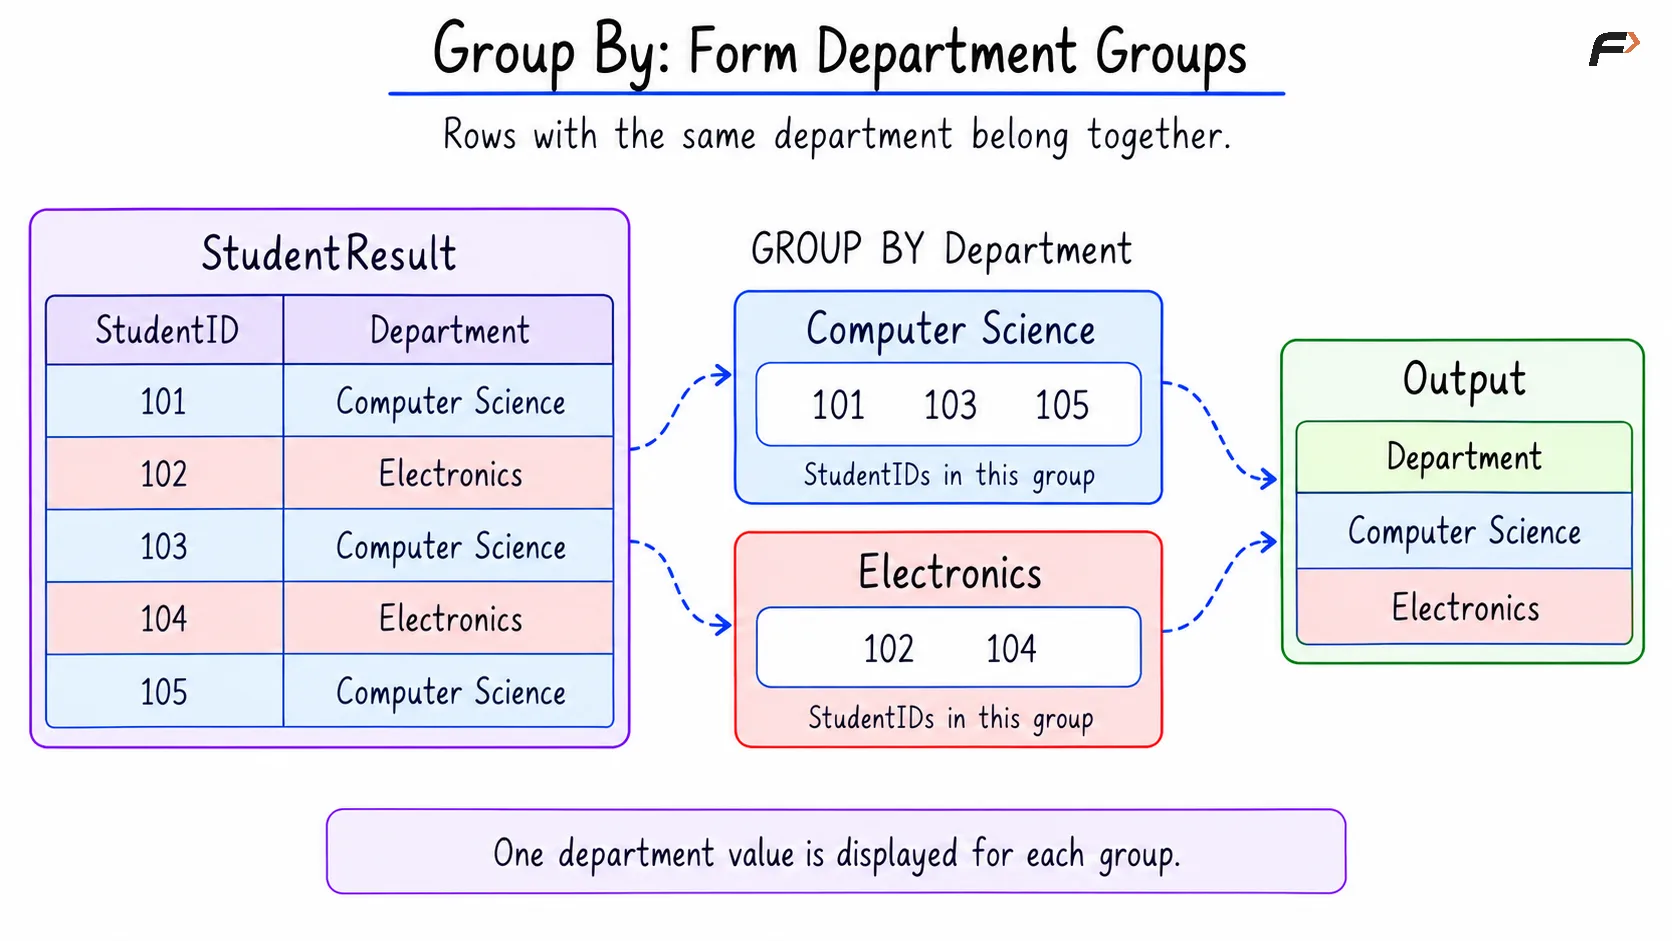
GROUP BY collects rows with the same grouping values.
Objective: Display each department represented in StudentResult once.
The department values in the source table are:
StudentID | Department |
|---|---|
101 | Computer Science |
102 | Electronics |
103 | Computer Science |
104 | Electronics |
105 | Computer Science |
Consider the following queries to form one group for each department and display its name.
SELECT DepartmentFROM StudentResultGROUP BY Department;Expected result
Department |
|---|
Computer Science |
Electronics |
The three Computer Science records belong to one group. The two Electronics records belong to another.
This query displays the grouping values. Aggregate functions can then be added to calculate information such as the number of students or average marks in each group.
The grouping columns determine the level of detail. For example, grouping a suitable table by both department and semester would produce a separate summary for each department–semester combination.
Group By : Form Department groups
5. Aggregate Functions: Calculate Summaries
An aggregate function calculates one result from a collection of input rows.
Objective: Calculate each department’s student count, recorded-result count, total marks, average marks, minimum marks, and maximum marks.
The calculations use these records:
StudentID | Department | Marks |
|---|---|---|
101 | Computer Science | 80.00 |
102 | Electronics | 60.00 |
103 | Computer Science | 90.00 |
104 | Electronics | 70.00 |
105 | Computer Science | NULL |
The main aggregate functions are:
Expression | Purpose |
|---|---|
| Counts all rows in the group. |
| Counts rows with non- |
| Adds the recorded marks. |
| Calculates the average of the recorded marks. |
| Finds the lowest recorded marks. |
| Finds the highest recorded marks. |
Consider the following queries to calculate a result summary for each department.
SELECT Department AS department, COUNT(*) AS student_count, COUNT(Marks) AS graded_count, SUM(Marks) AS total_marks, ROUND(AVG(Marks), 2) AS average_marks, MIN(Marks) AS minimum_marks, MAX(Marks) AS maximum_marksFROM StudentResultGROUP BY Department;Expected result
department | student_count | graded_count | total_marks | average_marks | minimum_marks | maximum_marks |
|---|---|---|---|---|---|---|
Computer Science | 3 | 2 | 170.00 | 85.00 | 80.00 | 90.00 |
Electronics | 2 | 2 | 130.00 | 65.00 | 60.00 | 70.00 |
AS assigns a readable alias to an output column. ROUND(AVG(Marks), 2) rounds the average to two decimal places.
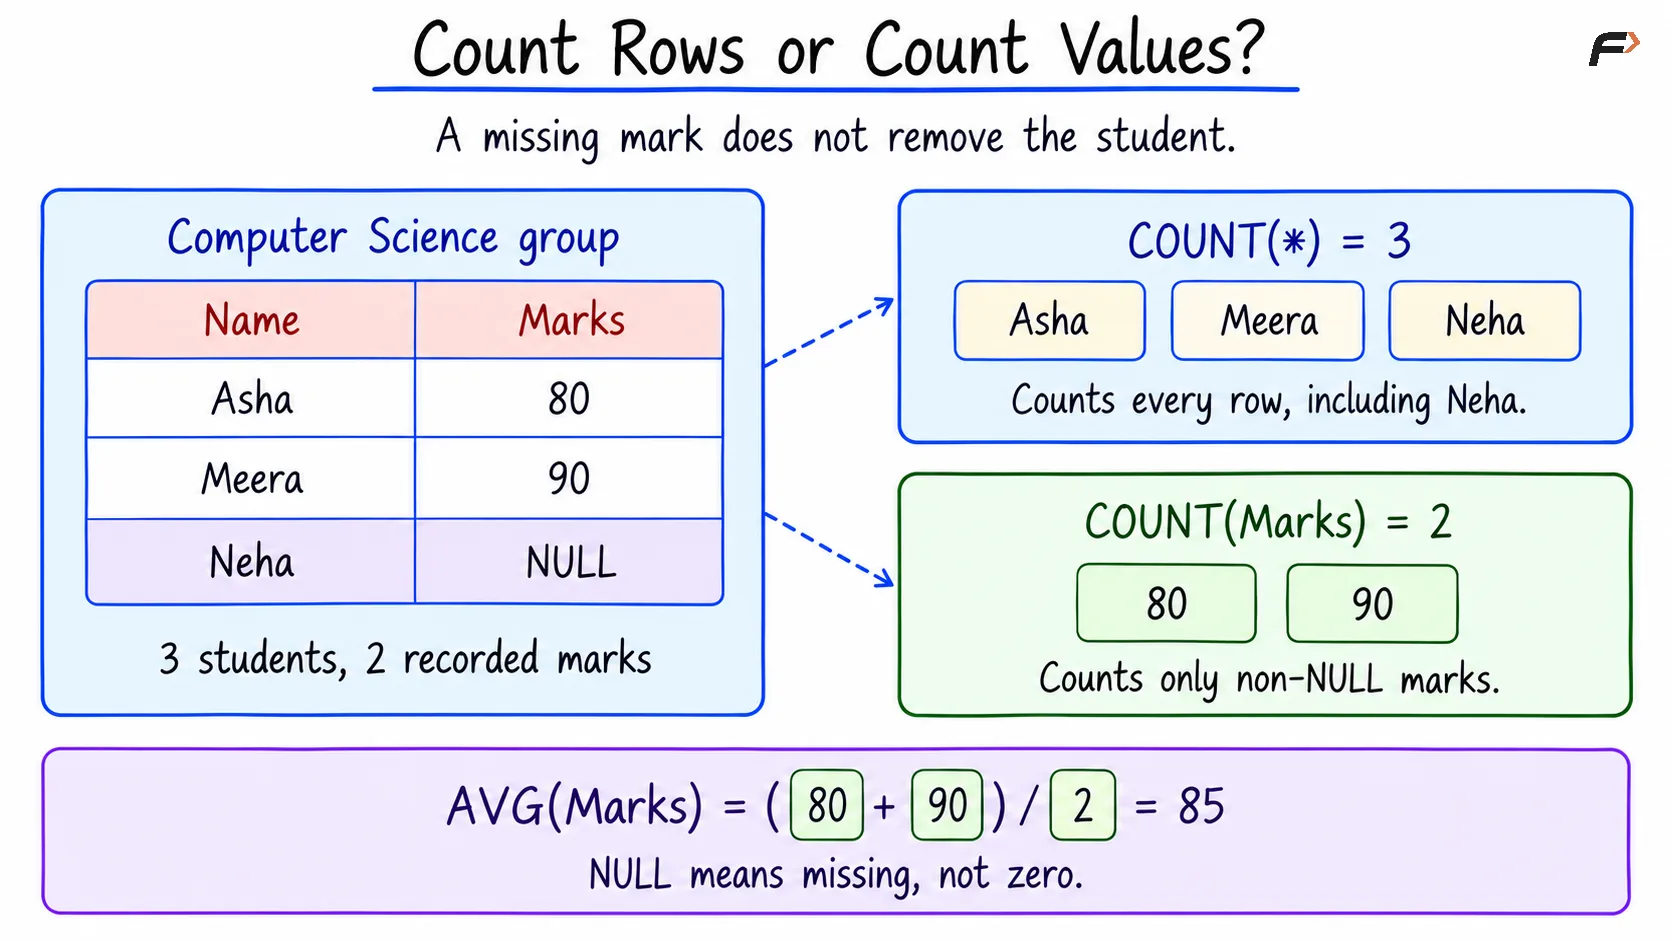
Computer Science has three students but only two recorded results:
COUNT(*)returns 3, including Neha’s row.COUNT(Marks)returns 2, excluding herNULLmarks.The total is 170, and the average is 85, calculated from 80 and 90.
SUM, AVG, MIN, and MAX ignore NULL inputs. If a group has no recorded marks, these functions return NULL, while COUNT(Marks) returns 0.
Count rows or Count values
Without GROUP BY, an aggregate query can summarize all qualifying rows together instead of producing a separate result for each department.
6. HAVING: Filter Groups
HAVING filters groups using conditions on their summarized values.
Objective: Display departments whose average recorded marks are at least 80.
The departmental averages calculated from StudentResult are:
Department | Average recorded marks |
|---|---|
Computer Science | 85.00 |
Electronics | 65.00 |
Consider the following queries to retain only departments whose average recorded marks meet the threshold.
SELECT Department AS department, ROUND(AVG(Marks), 2) AS average_marksFROM StudentResultGROUP BY DepartmentHAVING AVG(Marks) >= 80;Expected result
department | average_marks |
|---|---|
Computer Science | 85.00 |
Computer Science remains because its average is 85. Electronics is excluded because its average is 65.
The difference between the filtering clauses is:
Clause | Filters | Example requirement |
|---|---|---|
| Individual rows before grouping | Students who scored at least 75 |
| Groups after aggregation | Departments whose average marks are at least 80 |
A condition on the current group’s average belongs in HAVING, because the average is calculated from the records forming that group.
WHERE VS HAVING
7. ORDER BY: Sort the Results
ORDER BY arranges the output rows in a specified order.
Objective: List students with recorded marks from highest to lowest.
The relevant source values are:
StudentID | Name | Marks |
|---|---|---|
101 | Asha | 80.00 |
102 | Ravi | 60.00 |
103 | Meera | 90.00 |
104 | Arjun | 70.00 |
105 | Neha | NULL |
Consider the following queries to display recorded results in descending order of marks.
SELECT StudentID, Name, MarksFROM StudentResultWHERE Marks IS NOT NULLORDER BY Marks DESC, StudentID ASC;Expected result
StudentID | Name | Marks |
|---|---|---|
103 | Meera | 90.00 |
101 | Asha | 80.00 |
104 | Arjun | 70.00 |
102 | Ravi | 60.00 |
IS NOT NULL keeps rows with recorded marks.
DESC means descending order, while ASC means ascending order. Marks determine the main ordering. If two students have the same marks, StudentID ASC places the smaller identifier first.
Combining the Operations into a Department Report
The final example uses the following data:
StudentID | Name | Department | Marks |
|---|---|---|---|
101 | Asha | Computer Science | 80.00 |
102 | Ravi | Electronics | 60.00 |
103 | Meera | Computer Science | 90.00 |
104 | Arjun | Electronics | 70.00 |
105 | Neha | Computer Science | NULL |
Objective: Consider students who scored at least 70 and produce a departmental report that:
Includes only departments with at least two qualifying students and an average of at least 80.
Displays the qualifying student count, total, average, minimum, and maximum marks.
Sorts departments by average marks from highest to lowest, using department name to resolve ties.
Consider the following queries to produce the departmental report using the clauses and aggregate functions discussed above.
SELECT Department AS department, COUNT(*) AS student_count, SUM(Marks) AS total_marks, ROUND(AVG(Marks), 2) AS average_marks, MIN(Marks) AS minimum_marks, MAX(Marks) AS maximum_marksFROM StudentResultWHERE Marks >= 70GROUP BY DepartmentHAVING COUNT(*) >= 2 AND AVG(Marks) >= 80ORDER BY average_marks DESC, department ASC;Expected result
department | student_count | total_marks | average_marks | minimum_marks | maximum_marks |
|---|---|---|---|---|---|
Computer Science | 2 | 170.00 | 85.00 | 80.00 | 90.00 |
Each part of the query contributes to the objective:
SELECTspecifies the department and summary columns to display.FROMidentifiesStudentResultas the source.WHEREkeeps Asha, Meera, and Arjun because their marks are at least 70.GROUP BYgroups these qualifying students by department.Aggregate functions calculate each group’s count, total, average, minimum, and maximum.
HAVINGrequires at least two qualifying students and an average of at least 80.ANDrequires both conditions to be true.ORDER BYsorts the resulting report by average and then department name.
Computer Science qualifies with Asha and Meera. Their marks total 170, and their average is 85.
Electronics has only one qualifying student, Arjun, whose marks are 70. It fails both conditions in HAVING and is excluded.
The displayed student count represents students who passed the query’s filter, not every student in the department.
Summary
Data summarization in DBMS uses SELECT to specify the required output and FROM to identify its source. WHERE filters individual records, GROUP BY forms groups, and aggregate functions calculate counts, totals, averages, minimums, and maximums.
HAVING filters summarized groups, while ORDER BY arranges the results. A clear reporting objective, appropriate grouping, and correct handling of NULL help ensure that the final report represents the intended data.
Be the first to add a comment.